


Zendesk vs Salesforce: Which Fits Your Organization best?
Zendesk 08.12.2023 

6 Key Indicators to Track Customer Loyalty
Nowadays, it’s crucial that support agents regularly monitor customer engagement metrics. Providing an exceptional customer experience should be a priority, as one negative interaction can permanently damage customer relationships and long-term loyalty. Proactively monitor retention, seek feedback, and resolve issues swiftly to retain trust rather than lose customers after a single bad experience.
In this article, we will help you understand which metrics to pay attention to first, how to measure customer loyalty and do the customer loyalty analysis, and how to apply this knowledge to customer retention.
1. Customer Churn Rate
The churn rate is a ratio that shows the number of users who have stopped using your services. Determining this ratio is very simple. You need to know the number of clients at the beginning of the selected period and then the number of clients at the end of the same period. Knowing these two customer loyalty indicators, you can easily determine the churn rate using the following formula:
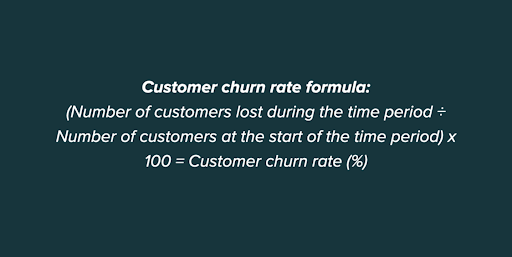
Knowing this metric is crucial because the company will only grow with a high churn rate. If your churn rate is high, you should consider changing your sales agent strategy and focus on satisfying your customers.
If you’re looking for strategies to enhance your customer’s initial experience, this detailed article on the customer onboarding process is a must-read. It’s packed with actionable tips and examples.
2. Customer Retention Rate (CRR)
Another important metric is the customer retention rate. If the previous metric can determine how many clients stop using your services, this metric will show what the retention rate of new clients is. In order to determine this metric, you will need to identify how many clients there were at the beginning of the selected period, how many at the end, and the number of new clients during the same period. Then, give this customer loyalty measurement calculation to a formula:
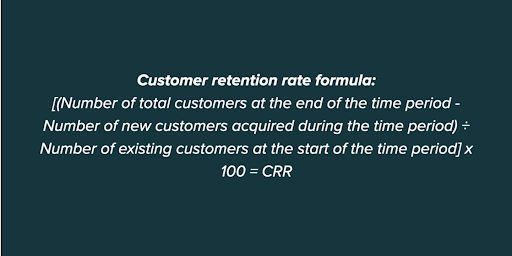
According to Bain & Company research, even a 5% increase in CRR can increase a company’s profits by 25%. That is why it is important to pay attention to this indicator.
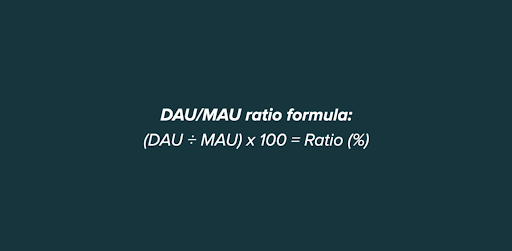
3. Active users per day, week, and month (DAU, WAU, MAU)
This metric will indicate how many active customers interact with your company over a specific period, namely per day, week, or month.
Why is this metric important in measuring brand loyalty? You can use the results of the counts to compare metrics and determine how important your product or service is to the customer. It can also help you predict revenue.
To determine this indicator, you must use the customer engagement data for a specific period (day and month) in the formula below.
4. Product Return Rate
The name of the indicator speaks for itself. This ratio indicates what percentage of goods sold are returned after purchase. This ratio is applicable and is only important for companies that are solely involved in the sale of goods.
To calculate the product return rate, you need to use the number of products sold and the number of products returned to the formula below.
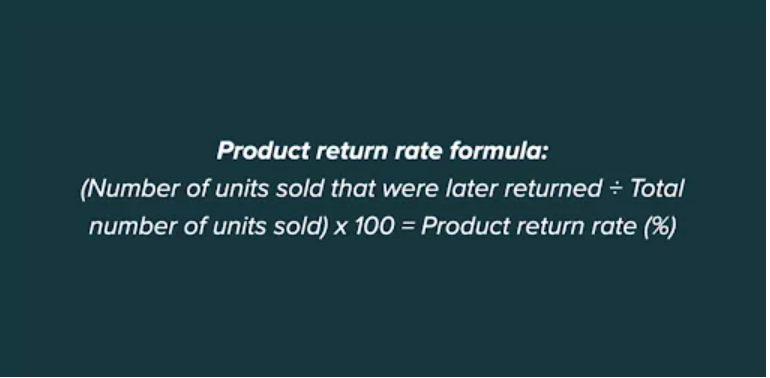
A high return rate can be a wake-up call for your company. If the PRR percentage is higher than the revenue percentage, consider whether there is nothing wrong with your product. To be sure there is nothing wrong with your product, read customer feedback more often.
5. Time Between Purchases (TBP)
Time Between Purchase (TBP) is also a customer loyalty metrics that shows how much time usually passes between your customer’s first and second purchase. First, let’s calculate your company’s purchase frequency (PF).
The number of orders (during the year) ÷ Number of unique customers (during the year) = PF.
Then, with this information, you can find out the time between purchases using the following formula:
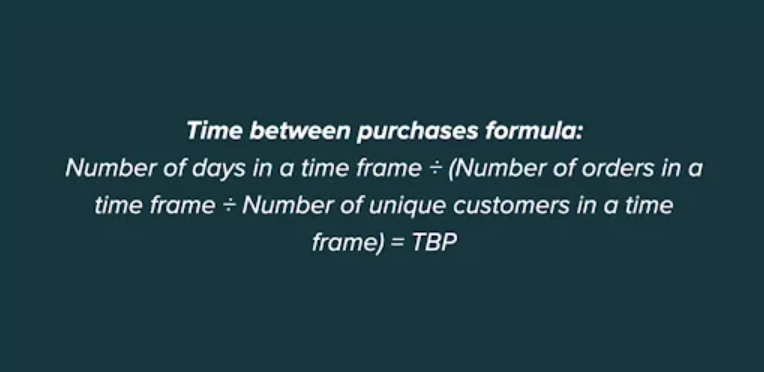
This indicator will help you compare your time-to-purchase ratio with that of your competitors. A short time-between-purchase ratio will let you know that your product fully satisfies your customer, while a long one will let you know that you need to improve your product or customer support.
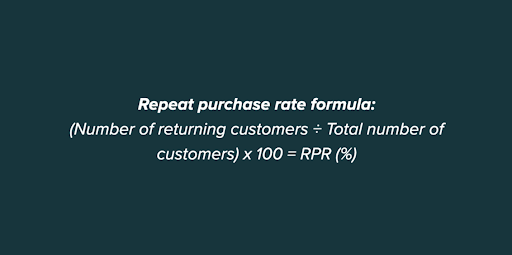
6. Repeat Purchase Rate
This metric will give you an idea of what percentage of customers make a repeat purchase of your product or service. To make this brand loyalty measurement, you need to divide the number of repeat users by the number of customers in total.
This coefficient will also help you determine which customer segment makes repeat purchases from you. This way, you can better understand your target audience and also understand whether you are encouraging your customers and buyers.
Do you need help with Zendesk and Salesforce for your business operations? Our article comparing Zendesk vs Salesforce is your guide to understanding the nuances of each platform. Uncover insights into their capabilities, integrations, and find the perfect fit for your unique business needs.
Bonus Metric: Customer Loyalty Index (CLI)
The Customer Loyalty Index (CLI) is a comprehensive metric that gauges a customer’s allegiance to a brand. Unlike NPS, CLI extends beyond mere recommendation likelihood, encompassing factors such as repeat and additional purchases by the customer.
CLI is determined by responses to the following three questions:
- How likely are you to recommend the business to your friends and family?
- How likely are you to buy from the company again?
- How likely are you to try other products or services?
Respondents rate these questions on a scale of 1-6, where 1 signifies the highest likelihood, and 6 indicates the least likely. The CLI score is derived from the average of these responses.
Optimize processes for calculating customer loyalty rates
The process of calculating and measuring customer loyalty and using them in your analytics can be a somewhat complex issue for your sales agents. To get ahead of all the important ratios that will help you improve your customer experience, you can use the Zendesk customer experience platform. Collect, analyze, and update all the most relevant information relating to your customers in one convenient place.
Do you still have questions about calculating metrics or want access to Zendesk professional services? Then, contact the Cloudfresh experts with any questions.
Services Offered by Cloudfresh:
- Implementation
- Audit and consulting services
- Setting up the essentials
- Training and demo sessions on how to use the solution
- Integrations development
- AI in customer support and chatbot solutions from strategy to implementation
At Cloudfresh, we deliver exceptional customer experiences while ensuring compliance support (GDPR, HIPAA, etc.) across the complete suite of Zendesk products, including Support, Sell, Sunshine Platform, Marketplace apps, and integrations.
Our team is ready to assist you seamlessly with AI functionalities, diverse communication channels, phone systems, CRM platforms, databases, and more.
Ready to elevate your customer support journey? Contact our team today.

Get in touch with Сloudfresh