


Google’s Maps data: How does it work?
Google Maps 23.01.2023 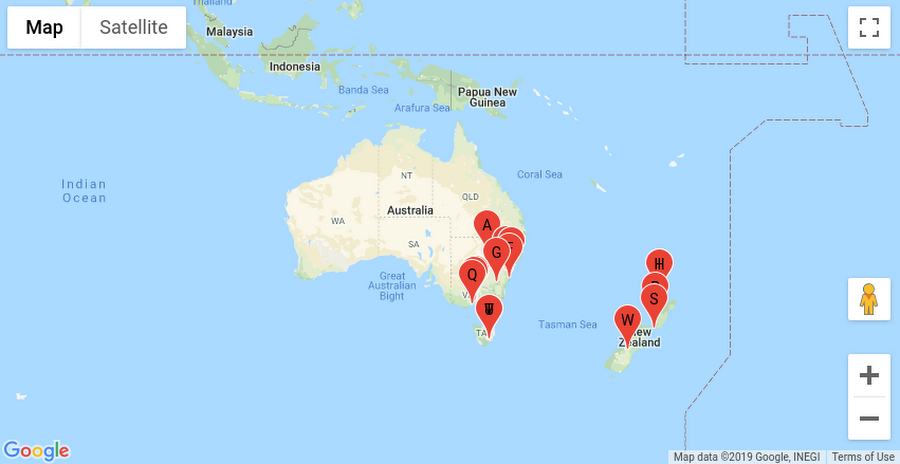


How to Group Markers on Google Maps
If you need to show a lot of geographic information in an accessible way, you are most likely using Google Maps. But it should be presented so that users can easily and quickly see the big picture and, if desired, get detailed information. Hundreds of point markers put together can become an obstacle.
In this post, we’ll show you how to use the Google Maps group markers JavaScript library to present the same information in a grouped way without displaying all the markers overlapping each other. We’ll also talk a bit about how it works to help you better understand how you can customize marker groups in your projects.
Why do we need marker grouping at all?
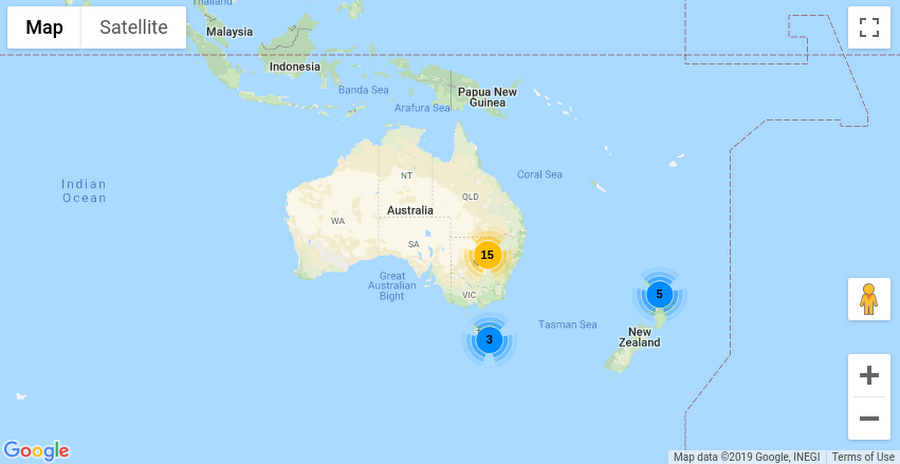
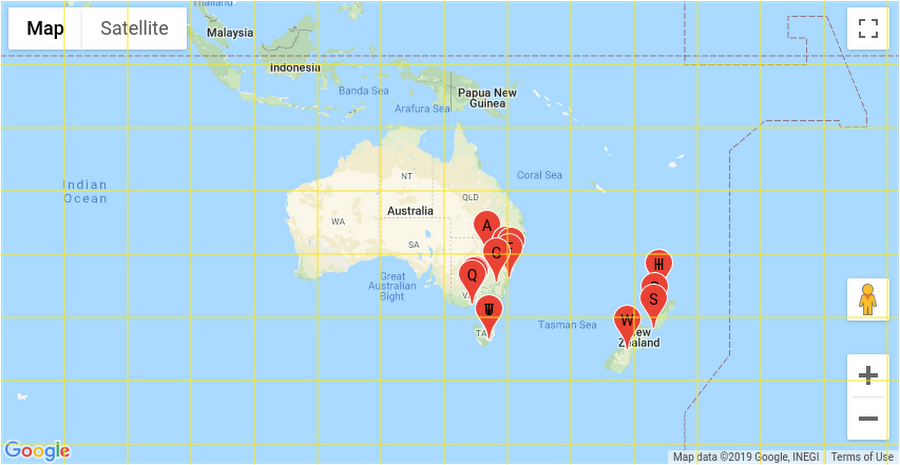
To understand, let’s look at this map of New Zealand and Australia with Google Maps clustering scattered around it:
Even though we have added a label for each marker, many of them are so close that they overlap. There are less than 25 locations, but they are too close to be shown on the map without overlap.
If your card looks something like this, it prevents your customers from conveniently and correctly perceiving the information you provide. But there is a solution — it is marker clustering. With a simple open-source library and a slight change to your map code, marker grouping can be added to improve the user experience for clients significantly.
Google Maps marker clustering is a handy tool for visually consolidating markers and making it easier for clients to read the map. It groups markers on Google Maps that are nearby on the map into a cluster displayed as a single icon.
Enable marker clustering on your map
You can add marker clustering with a few extra lines of JavaScript. This example demonstrates how to do this on web maps, but a similar utility exists within the Android Maps platform and the Google Maps platform SDK. To create a marker cluster, let’s first look at how to develop non-clustered markers. By adding regular markers to the map, the code would look like this:
const pos1 = {lat: -33.727111, lng: 150.371124};
const marker1 = new google.maps.Marker({position: pos1, map: map});
const pos2 = {lat: -33.718234, lng: 150.363181};
const marker2 = new google.maps.Marker({position: pos2, map: map});
With dozens or more markers, you’ll unlikely be able to create one at a time with your variables. However, these two markers are enough to see clustering in action.
You need to make two changes to the map code to enable marker clustering. First, download the marker clustering library. Download it from GitHub and host the JavaScript on your server for production. For this demo, we will download it from the Google Maps platform documentation site:
<script src=”https://developers.google.com/maps/documentation/javascript/examples/markerclusterer/markerclusterer.js”>
Next, bring the map and markers into the cluster Google Maps library by adding these lines below the marker variables:
// create an array of all your markers const markers = [marker1, marker2];
//Path for cluster icons to be appended (1.png, 2.png, etc.) const imagePath = “https://developers.google.com/maps/documentation/javascript/examples/markerclusterer/m”;
// Enable marker clustering for this map and these markers const markerClusterer = new MarkerClusterer(map, markers, {imagePath: imagePath});
Again, you must host cluster images on your servers for production use. This example will load m1.png because it only requires the minimum cluster size.
When you create a MarkerClusterer instance, you pass in your map variable, an array of markers, and an image path. The library, having received the information, displays the cluster icon with the number of points present in the cluster:
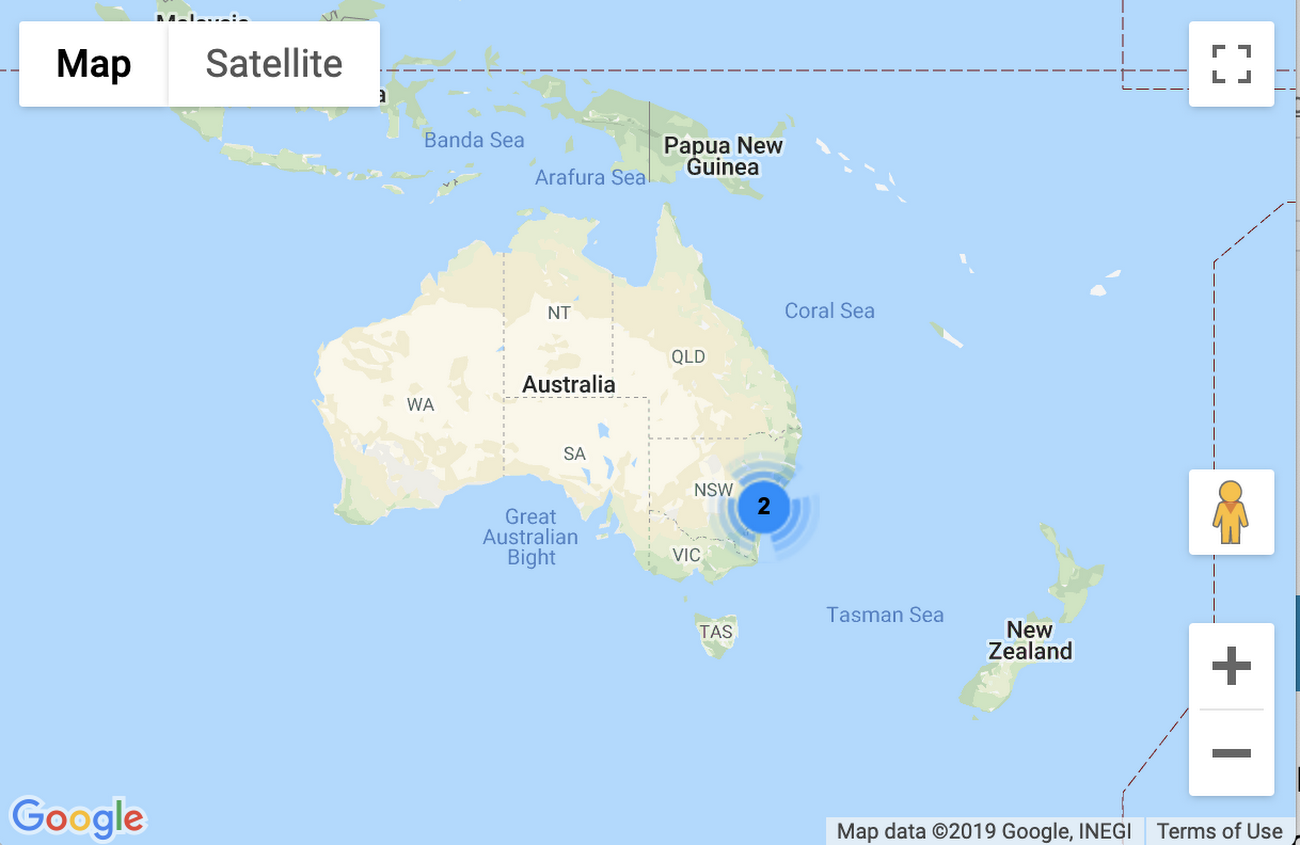
When you click on the cluster limits icon, the map is scaled to a level where both markers are visible.
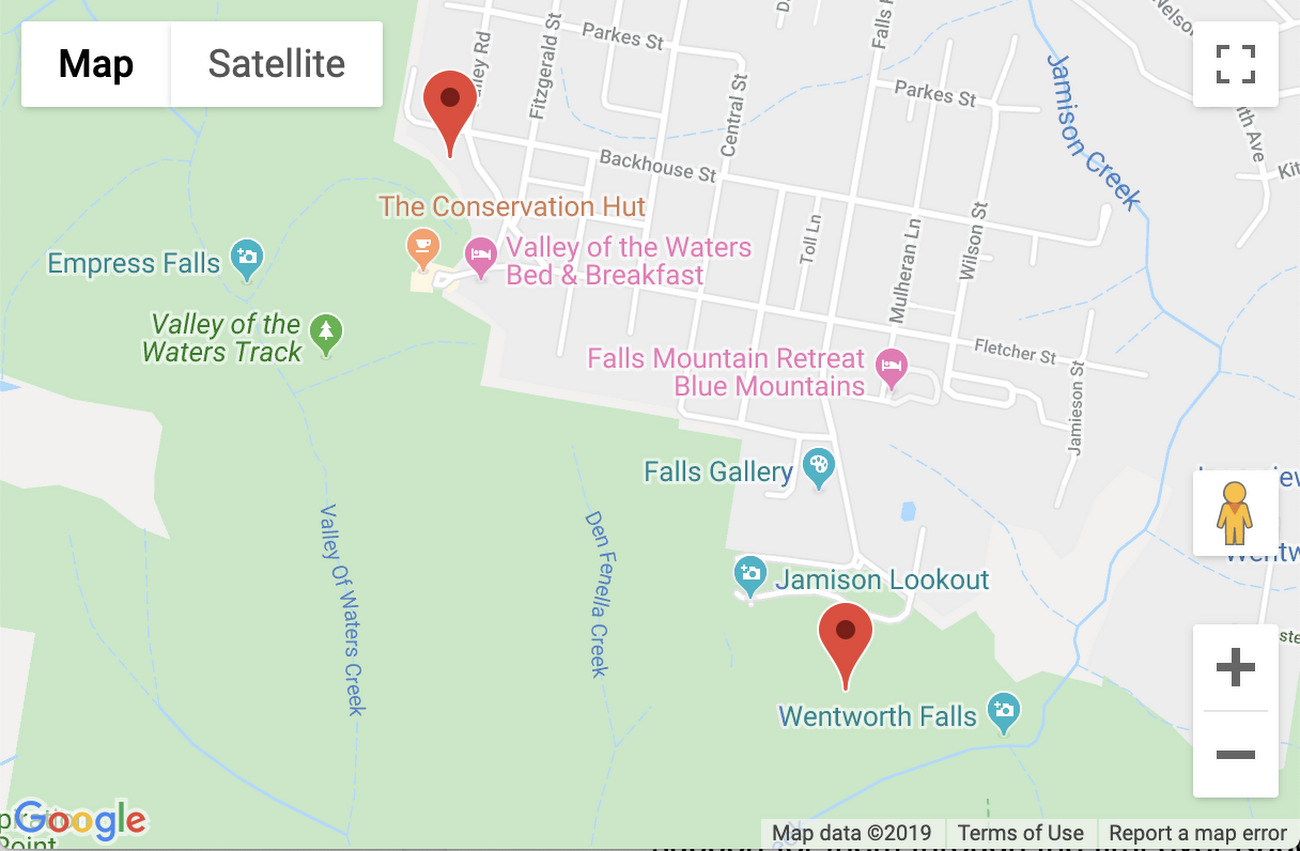
When you zoom out a few levels, the cluster icon will return instead of two markers once the map is at a level where they can overlap.
This marker clustering guide has full details and examples with more points.
How marker clustering works
The marker clustering library is part of the open source map utilities on GitHub. You can access all the code and even make your own changes as needed. Let’s take a look at how the algorithm works in general.
To begin with, the algorithm divides the map into a grid, with each section of the grid being 60×60 pixels by default. Using the marker overlap example above, this can be visualized as:
In fact, the grid will not be exactly the same as above since it is based on the markers themselves. The first marker becomes the center of the first sector. The next markers in that sector will be added to the cluster for that sector, and then the cluster center will be updated based on the average level of all its markers. If a marker could be part of multiple clusters, it will be added to the nearest one based on the distance between marker coordinates.
The default algorithm settings cover most use cases, but since the code is entirely open source, you can make any changes you need.
Customize your Google Maps clusterer
There are many ways to customize the look and feel of your marker clusters. Many of them won’t even require changing the underlying library. However, several options can be set when creating clusters.
The easiest way to customize the cluster Google Maps is to use your own icons. In a simple clustering example, we passed the imagePath parameter. The cluster library will assign a number (1-5) to the end of the Path followed by the file extension (.png by default). You can use a different file type with the imageExtension parameter. Keep in mind that transparent icons look better on the map.
By default, only two markers are needed to create a cluster. You can use the minimalClusterSize option to change this setting. Increasing this number can cause markers to overlap, but you can also set the overlap threshold.
Here are a few other options for working with the library:
gridSize: number of pixels in the cluster grid
zoomOnClick: zoom in on a cluster when it is clicked
maxZoom: maximum zoom level before always displaying regular markers
styles: array of objects for each cluster type, including textColor, textSize, and other cluster functions
For example, you can use all of the above options together as follows:
// Options to pass along to the marker clusterer const clusterOptions = { imagePath: “https://developers.google.com/maps/documentation/javascript/examples/markerclusterer/m”, gridSize: 30, zoomOnClick: false, maxZoom: 10 };
// Add a marker clusterer to manage the markers. const markerClusterer = new MarkerClusterer(map, markers, clusterOptions);
// Change styles after cluster is created const styles = markerClusterer.getStyles(); for (let i=0; i<styles.length; i++) { styles[i].textColor = “red”; styles[i].textSize = 18; }
For example, you can use all of the above options together as follows:
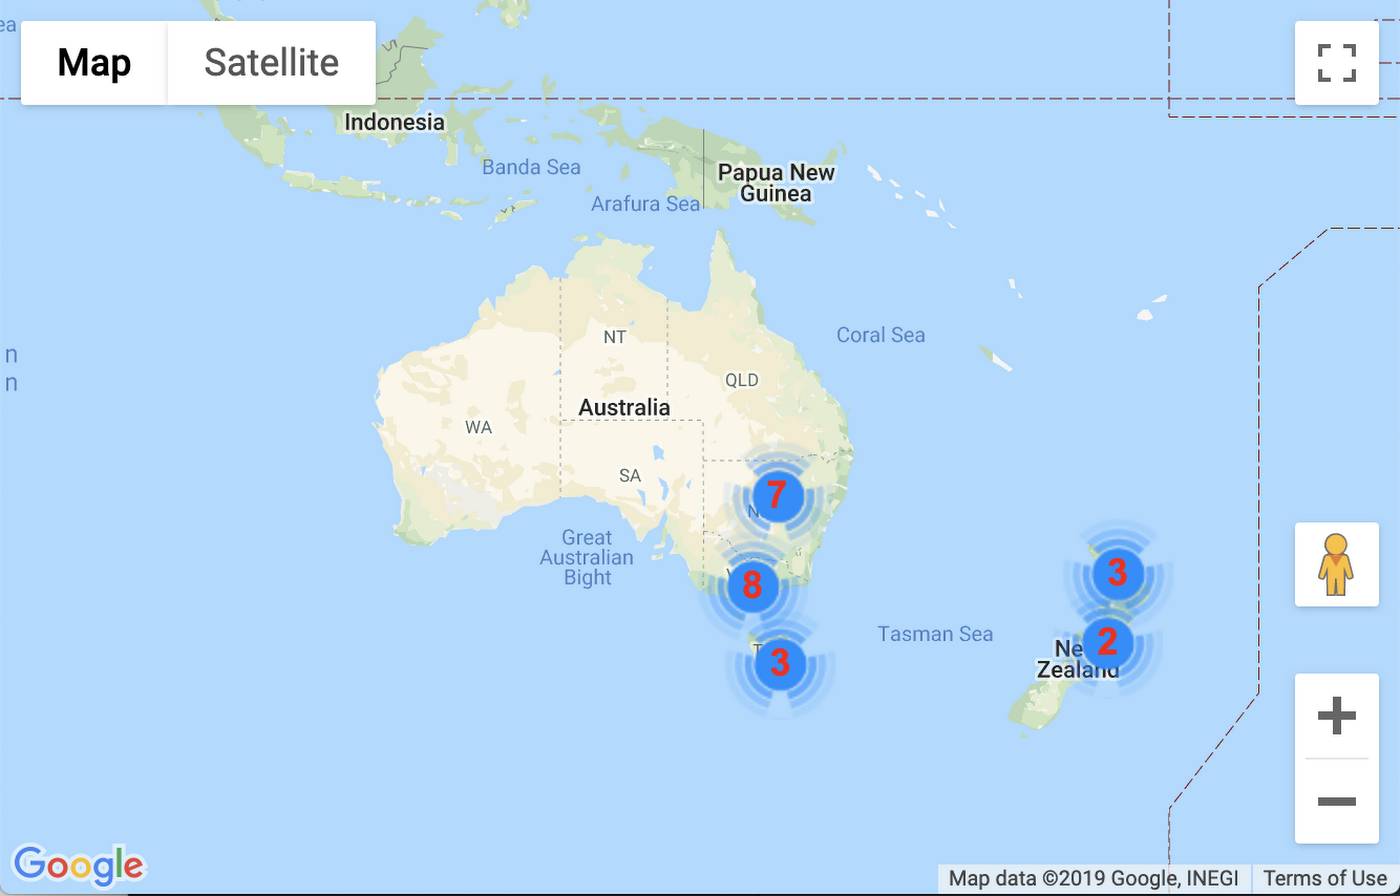
As you can see, there are two differences: more clusters (through a smaller grid size), and numbers are red and slightly larger.
When you click on a cluster, the scale will not change, but you can increase it manually. Individual markers will appear faster; grid size provides less chance of overlapping markers. Once you reach zoom level 10 (the map starts at level 3), all markers will be reflected, no matter how close.
Now, you’ve gone from a map spammed with markers to an elegantly clustered one. By reading its code, you can find more ways to customize the marker clustering library. Use this new knowledge to give your users a better experience on maps with many markers.
Please get in touch with our Google Maps Partner team for advice or technical expertise to implement these and other features.
What do we offer?
- Google Maps Platform-based development services;
- Technical teams’ training;
- Consultations and API integration;
- Technical support.
By cooperating with us, you will receive the following:
- Access to a seven-level discount system, which is possible only with a Google Maps partner;
- Payment by invoice in EUR, USD, CZK, PLN, UAH, or any other currency;
- Professional support throughout the journey with a solution.

Get in touch with Сloudfresh